Understanding the Gini Coefficient: A Comprehensive Guide
The Gini coefficient is a crucial statistical measure that helps us understand income and wealth distribution within a nation. It is a powerful tool for analyzing economic inequality, with values ranging from 0 to 1. A Gini coefficient of 0 indicates perfect equality, where everyone has the same income, while a coefficient of 1 represents maximum inequality, where one person holds all the wealth. This measure is essential for economists, policymakers, and researchers as it provides insights into societal disparities and helps track changes over time. In recent years, the importance of the Gini coefficient has grown, particularly as discussions about economic inequality have gained prominence. Understanding this metric can help us grasp the underlying factors contributing to inequality, enabling more informed policy decisions aimed at promoting equity. As we delve deeper into the Gini coefficient, we will explore its theoretical foundations, interpretation, historical context, and its applications beyond income distribution.
Introduction to the Gini Coefficient
The Gini coefficient serves as a numerical representation of income distribution within a population. It is calculated based on the Lorenz curve, which illustrates the proportion of total income earned by cumulative percentages of the population. The area between the Lorenz curve and the line of perfect equality informs the Gini coefficient, allowing for a visual understanding of inequality. This coefficient is not merely a statistic; it encapsulates the economic realities faced by individuals and families, highlighting disparities that can influence social cohesion and stability. The significance of the Gini coefficient extends beyond mere numbers. Policymakers use it to gauge the effectiveness of economic policies aimed at reducing inequality. For instance, if a country’s Gini coefficient decreases over time, it may indicate successful interventions that promote equitable income distribution. Conversely, a rising Gini coefficient could signal worsening inequality, prompting urgent policy responses. Thus, the Gini coefficient is integral to discussions about social justice, economic development, and overall societal well-being.
Theoretical Foundation
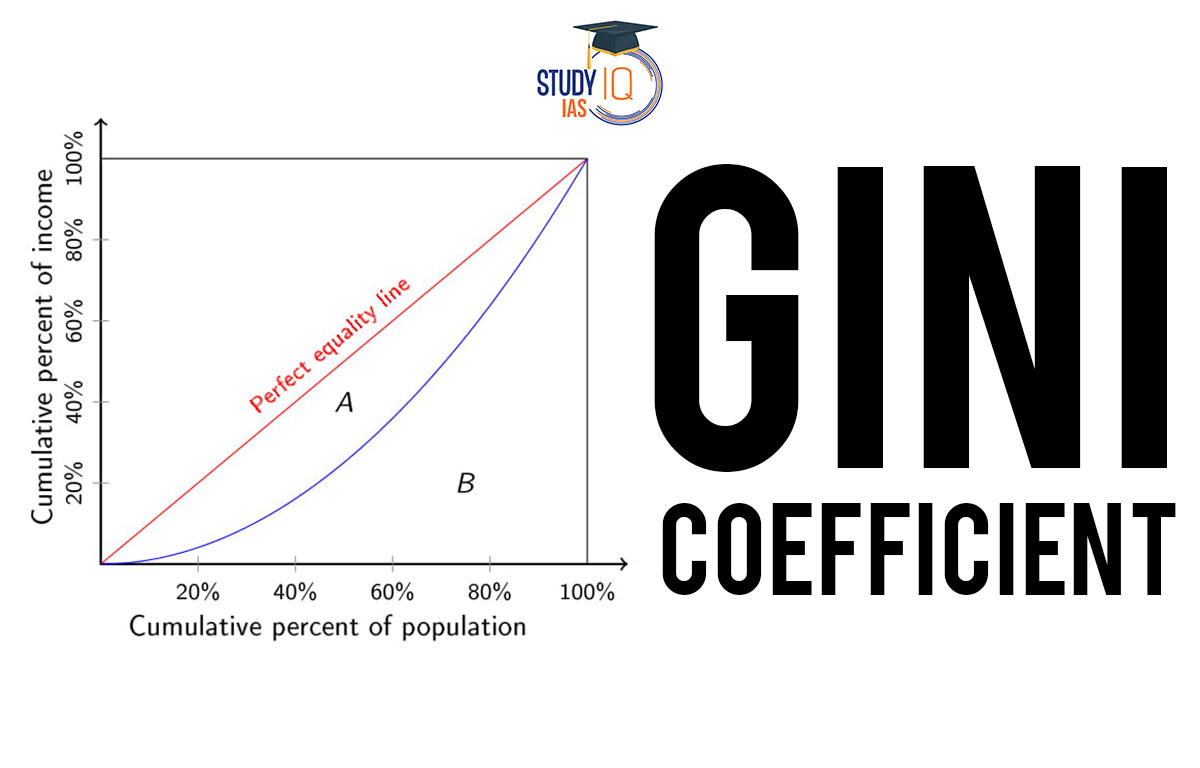
The calculation of the Gini coefficient is rooted in economic theory and statistical analysis. It primarily involves the area between the Lorenz curve and the line of equality, which represents a scenario where income is distributed evenly among all individuals. The formula for the Gini coefficient is expressed as: [ G = \frac{A}{A + B} ] In this equation, area A represents the area between the line of equality and the Lorenz curve, while area B is the area beneath the Lorenz curve. The ratio of these areas provides a quantitative measure of inequality. A Gini coefficient closer to 0 indicates a more equitable distribution, whereas a coefficient closer to 1 signifies greater inequality. Alternative methods for calculating the Gini coefficient exist, utilizing cumulative income data for different segments of the population. This approach reinforces the theoretical framework by allowing for a comprehensive analysis of income distribution across various demographics. By understanding these calculations, researchers can better interpret the implications of the Gini coefficient in real-world contexts, enabling more effective policy formulation.
Interpretation of Gini Coefficient Values
Understanding what different Gini coefficient values signify is essential for analyzing economic inequality. Generally, a Gini coefficient below 0.3 indicates a relatively equitable income distribution, while values between 0.3 and 0.4 suggest moderate inequality. Coefficients above 0.4 are often associated with high levels of inequality, which can lead to social unrest and economic instability. For instance, Scandinavian countries like Sweden and Norway typically exhibit Gini coefficients below 0.3 due to their comprehensive welfare systems and policies aimed at wealth redistribution. In contrast, nations such as Brazil and South Africa often report Gini coefficients above 0.5, reflecting significant income disparities and social challenges. These differences illustrate how income inequality can manifest in varying socio-economic landscapes. However, it is crucial to recognize the limitations of the Gini coefficient. While it provides valuable insights, it does not capture the full picture of economic health. For instance, two countries may have similar Gini coefficients yet differ vastly in living standards, access to education, and healthcare. Therefore, it is essential to consider the Gini coefficient in conjunction with other indicators to obtain a holistic understanding of a nation’s economic landscape.
Historical Context and Development
The Gini coefficient was developed by the Italian statistician Corrado Gini in the early 20th century, drawing on earlier theories posited by Vilfredo Pareto and Max O. Lorenz. Gini’s work emerged during a period of significant social and economic change, as industrialization and urbanization were reshaping societies. His coefficient aimed to provide a systematic approach to measuring income inequality, addressing the growing concerns about wealth distribution during that era. The historical context surrounding the Gini coefficient is essential for understanding its development and reception. Gini was a controversial figure, with political affiliations that influenced the perception of his work. Nevertheless, the Gini coefficient gained traction in economic research and policy discussions, becoming a standard measure of inequality in various countries. Over the decades, it has evolved to incorporate advancements in statistical methods and data collection, enhancing its applicability and relevance. As societies continue to grapple with issues of inequality, the Gini coefficient remains a vital tool for analyzing trends and informing policy decisions. Its historical roots provide a foundation for understanding contemporary discussions about income distribution and economic justice.
Applications Beyond Income Distribution
While the Gini coefficient is most commonly associated with income inequality, its applications extend far beyond this primary use. In recent years, researchers have explored its potential in fields such as predictive modeling and risk assessment. By examining the distribution of variables beyond income, the Gini coefficient can provide insights into various phenomena. For example, in finance, the Gini coefficient can assess the risk associated with credit portfolios by measuring the concentration of risk among borrowers. A higher Gini coefficient in this context indicates a greater concentration of risk, which could inform lending practices and risk management strategies. Similarly, in health economics, the Gini coefficient can evaluate disparities in healthcare access and outcomes, highlighting inequities that need to be addressed. Moreover, the Gini coefficient can be employed in environmental studies to assess the distribution of resources or pollution exposure among different populations. By applying this measure to diverse fields, researchers can uncover patterns of inequality and advocate for policies that promote fairness and sustainability. Thus, the Gini coefficient’s versatility makes it a valuable tool across various domains, enriching our understanding of complex social and economic dynamics.
Comparison with Other Inequality Measures
The Gini coefficient is not the only measure of inequality available; several other metrics provide alternative perspectives on income distribution. Among these are the Lorenz curve, Atkinson index, and Theil index. Each measure offers unique insights, with its strengths and weaknesses. The Lorenz curve visually represents income distribution, allowing for an intuitive understanding of inequality. It is often used in conjunction with the Gini coefficient to provide a more comprehensive analysis. The Atkinson index, on the other hand, incorporates social welfare considerations, emphasizing the impact of inequality on overall societal well-being. This measure allows for a more nuanced understanding of how inequality affects different segments of the population. The Theil index offers another perspective by decomposing inequality into within-group and between-group components, enabling researchers to pinpoint the sources of inequality. This decomposition can be particularly useful in multicultural societies where disparities may be rooted in ethnic or regional differences. By understanding the strengths and weaknesses of these various measures, researchers and policymakers can choose the most appropriate tools for their analyses, ensuring targeted and effective interventions.
Global Perspective on Income Inequality
Examining the Gini coefficient on a global scale reveals significant disparities in income distribution across different countries. Nations with the highest Gini coefficients, such as South Africa and Brazil, often struggle with social unrest and economic challenges linked to their levels of inequality. Conversely, countries like Denmark and Finland, with low Gini coefficients, typically enjoy more stable social environments and higher levels of overall well-being. A critical analysis of the Gini coefficient in relation to GDP per capita further illuminates the complexities of economic inequality. While wealthier nations generally exhibit lower Gini coefficients, this is not universally true. For example, some high-income countries still grapple with significant income disparities, demonstrating that economic prosperity does not automatically equate to equitable distribution. Understanding the socio-economic factors that influence Gini coefficient values is essential for addressing income inequality. Factors such as education, labor market conditions, and social policies play crucial roles in shaping income distribution. By contextualizing the Gini coefficient within broader global economic trends, we can better understand the challenges and opportunities facing different nations in their pursuit of equity and social justice.
Criticisms and Limitations
Despite its widespread use, the Gini coefficient has faced criticism for oversimplifying complex social dynamics. Critics argue that it reduces multifaceted issues of inequality to a single number, which can obscure important nuances. For instance, while the Gini coefficient can indicate the degree of income inequality, it does not account for qualitative aspects of life such as standard of living, access to education, or healthcare quality. Additionally, the Gini coefficient may not adequately reflect the experiences of marginalized groups within a population. For example, a society may have a relatively low Gini coefficient while still exhibiting significant disparities among specific demographics, such as racial or ethnic minorities. This limitation underscores the importance of using the Gini coefficient alongside other indicators to garner a more comprehensive understanding of inequality. Moreover, the Gini coefficient does not capture changes in distribution over time, which can be crucial for assessing the impacts of policy interventions. As such, researchers and policymakers must approach the Gini coefficient with caution, ensuring that it is part of a broader toolkit for analyzing inequality and informing social policies.
Conclusion and Future Implications
In conclusion, the Gini coefficient plays a vital role in contemporary economic discussions, serving as a barometer for income inequality and social justice. As we have explored throughout this guide, it provides valuable insights into the distribution of wealth and the implications for societal well-being. Understanding the Gini coefficient is essential for policymakers seeking to address economic disparities and promote equitable growth. Moving forward, it is crucial for researchers and policymakers to continue exploring innovative approaches to measuring and addressing inequality. The Gini coefficient should be utilized in conjunction with other metrics and qualitative assessments to inform comprehensive policy strategies. Ongoing research and dialogue around income distribution are essential for fostering a more equitable society, ensuring that the voices of all individuals are heard and considered in the pursuit of economic justice. As we grapple with the challenges of inequality in an increasingly interconnected world, the Gini coefficient will remain a cornerstone of discussions surrounding economic policy and social equity. By leveraging this measure effectively, we can work towards a future that prioritizes fairness, opportunity, and well-being for all.
Sponsored Links