Understanding the Gini Coefficient and Wealth Inequality
The Gini coefficient is a pivotal statistical measure that assesses income or wealth inequality within a population. It ranges from 0, indicating perfect equality, to 1, which signifies maximum inequality. This metric is crucial for economists and policymakers, as it uncovers disparities that can profoundly impact social stability and economic growth. While the Gini index provides a snapshot of inequality, it often lacks the necessary context regarding overall living standards. Consequently, a broader analysis is essential when comparing different societies to understand the implications of these inequalities fully. For instance, a Gini coefficient of 0.45 might indicate significant inequality in one country while representing a different economic context in another. Thus, while the Gini coefficient is an essential tool for measuring inequality, it must be interpreted alongside other socioeconomic indicators. By doing so, stakeholders can better grasp the multifaceted nature of wealth distribution and its effects on society. This understanding is vital for developing effective policies aimed at reducing inequality and fostering more equitable economic growth.
Introduction to the Gini Coefficient
The Gini coefficient serves as a critical barometer for measuring wealth distribution within societies. It has gained widespread recognition among economists and social scientists for its ability to succinctly convey complex information about income disparities. The coefficient’s formulation allows it to capture the extent to which income is distributed unevenly among a population. In practical terms, a lower Gini coefficient reflects a more equal income distribution, suggesting a healthier societal structure where wealth is shared more evenly. Conversely, a higher coefficient indicates a concentration of wealth among a small percentage of the population, often resulting in social tension and economic challenges. The Gini coefficient’s simplicity is one of its greatest strengths; it provides a straightforward number that can be easily communicated and understood. However, practitioners and researchers must remember that the Gini coefficient does not exist in a vacuum. It must be contextualized within broader economic and social frameworks. For instance, two countries could have the same Gini coefficient yet exhibit vastly different living conditions, economic opportunities, and social mobility. Therefore, while the Gini coefficient is an important tool for understanding income inequality, it is essential to consider it alongside other metrics that capture the overall quality of life and economic well-being in various societies.
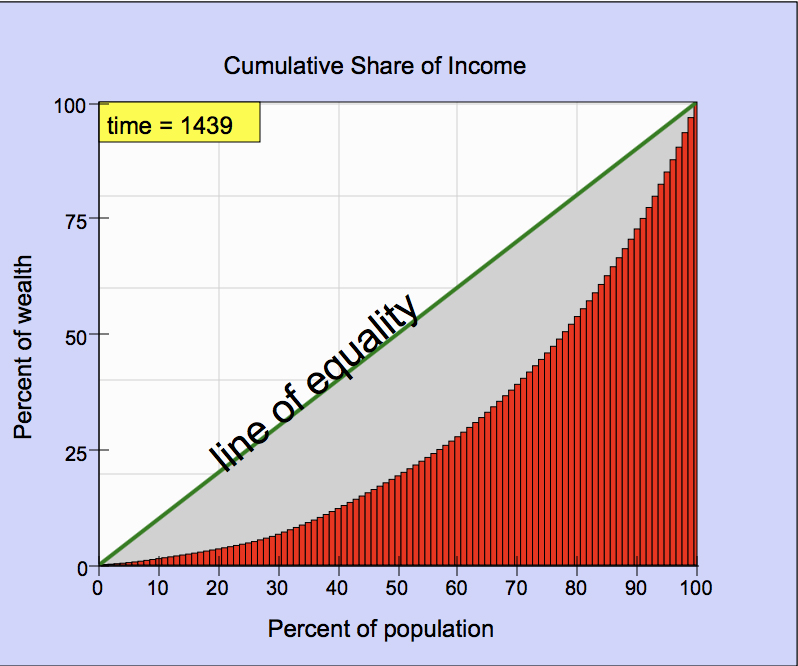
The Lorenz Curve: A Visual Representation
To understand the Gini coefficient thoroughly, one must also comprehend the Lorenz curve, which visually represents income distribution within a population. The Lorenz curve plots the cumulative percentage of total income received by the cumulative percentage of the population. This graphical representation illustrates disparities in wealth distribution effectively. In a perfectly equal society, the Lorenz curve would form a 45-degree line, indicating that every segment of the population earns an equal share of total income. However, in reality, the Lorenz curve typically bows below this line, reflecting the inequalities present in the income distribution. The degree to which the curve deviates from the line of equality provides a clear visual indicator of the level of inequality in a given society. The area between the Lorenz curve and the line of equality is critical for calculating the Gini coefficient. The larger this area, the higher the Gini coefficient, indicating greater inequality. Understanding the Lorenz curve is essential for visualizing how wealth is spread across different segments of society and recognizing the implications of these disparities. It serves as a useful complement to the Gini coefficient, allowing policymakers and researchers to grasp the nuances of income distribution more effectively.
State-by-State Breakdown of Gini Coefficients in the U.S.
Examining Gini coefficients across U.S. states reveals significant disparities in wealth distribution that warrant attention. For example, the District of Columbia has the highest Gini index at 0.532, signifying extreme inequality, while states like Alaska show a much lower Gini coefficient of 0.402, indicating a more equitable distribution of wealth. This stark contrast highlights the varying economic landscapes and social factors influencing income distribution across different regions. The state-by-state analysis of Gini coefficients can provide valuable insights into regional economic policies, demographic trends, and social issues contributing to these disparities. For instance, states with higher Gini coefficients may experience greater social tensions, crime rates, and lower overall quality of life compared to those with lower coefficients. This data can inform targeted interventions to address inequality at local levels, allowing policymakers to tailor strategies that meet the unique needs of their communities. Moreover, understanding these state-level disparities can guide federal policy initiatives aimed at reducing inequality. By identifying states with the greatest challenges, lawmakers can develop comprehensive strategies that address the root causes of wealth inequality, such as inadequate access to education and job opportunities. This localized approach can foster more equitable economic growth and improve the overall well-being of the population.
Historical Context and Evolution of the Gini Coefficient
The Gini coefficient was introduced in the early 20th century by Italian statistician Corrado Gini, who sought a quantitative measure of income distribution. His work was inspired by earlier theories on wealth distribution, notably the Pareto principle, which posits that a small percentage of the population controls a large share of wealth. Gini’s innovation provided economists and social scientists with a standardized tool to assess and compare income inequality across different populations. Over the decades, the Gini coefficient has evolved and found applications in various fields beyond economics, including sociology, political science, and health care. As economic disparities became increasingly recognized as critical issues affecting societal stability, the Gini coefficient gained traction as a vital metric for understanding these dynamics. Its simplicity and versatility have made it an indispensable tool in contemporary research and policy discussions. Understanding the historical roots of the Gini coefficient is crucial for appreciating its relevance in modern economic discussions. As societies grapple with growing inequality, the Gini coefficient serves as a critical point of reference for examining changes in wealth distribution over time. By analyzing trends in Gini coefficients across different periods, researchers can gain insights into the effectiveness of various economic policies and social interventions aimed at reducing inequality.
Limitations of the Gini Coefficient
Despite its widespread use, the Gini coefficient has notable limitations that must be acknowledged. One significant drawback is that it does not account for variations in living standards or quality of life within populations. Two countries may have identical Gini coefficients but vastly different contexts, living conditions, and economic opportunities, making cross-societal comparisons challenging. Additionally, the Gini coefficient can mask significant disparities within subgroups of a population. For instance, while a country may exhibit a relatively low Gini coefficient overall, certain demographic groups may experience extreme inequality. This limitation underscores the necessity for supplementary measures that provide a more comprehensive view of inequality, such as income distribution metrics that account for different demographic factors. Moreover, the Gini coefficient may not reflect the full spectrum of economic disparities, particularly in rapidly changing economies. Factors such as technological advancements, globalization, and shifts in labor markets can influence income distribution in ways that the Gini coefficient alone may not capture. Therefore, researchers and policymakers must approach the Gini coefficient with a critical eye, using it alongside other metrics to form a well-rounded understanding of economic inequality.
Global Comparisons and Trends
When comparing Gini coefficients globally, stark differences emerge that reveal the varying levels of wealth inequality across countries. Countries with Gini coefficients exceeding 50% are generally considered highly unequal, while those with coefficients below 30% are viewed as relatively equal. The United States, with a Gini coefficient around 0.468, ranks poorly among developed nations, especially concerning net income inequality after taxes and transfers. These global comparisons are crucial for understanding the broader landscape of inequality and the effectiveness of different economic policies. For example, countries with lower Gini coefficients often implement robust social safety nets, progressive taxation, and inclusive economic policies that help reduce income disparities. By studying these successful models, policymakers in higher Gini coefficient countries can learn valuable lessons and adapt strategies to address their own inequality challenges. Furthermore, understanding global trends in income inequality can inform international discussions and collaborations aimed at promoting equitable economic growth. As countries increasingly recognize the importance of addressing inequality, the Gini coefficient serves as an essential tool for evaluating progress and identifying areas for improvement. By fostering international dialogue on best practices and successful interventions, nations can work together to create a more equitable global economy.
The Gini Coefficient in Predictive Analytics
In recent years, the Gini coefficient has found applications beyond traditional economic analysis, particularly in the field of predictive analytics. Its utility in risk assessment models has garnered attention, as it provides a framework for evaluating the effectiveness of predictive models in various contexts. By sorting cases based on predicted outcomes, the Gini coefficient can indicate how well a model differentiates between positive and negative outcomes. This application of the Gini coefficient reflects its versatility, extending its relevance to areas such as finance, healthcare, and social sciences. For instance, in credit scoring, a higher Gini coefficient can signify a model’s effectiveness in predicting loan defaults, helping lenders make informed decisions about creditworthiness. Similarly, in healthcare, the Gini coefficient can be utilized to assess the accuracy of predictive models in identifying patients at risk of adverse health outcomes, ultimately improving patient care. Moreover, the growing use of the Gini coefficient in predictive analytics underscores the importance of data-driven decision-making in various sectors. As organizations increasingly rely on analytical models to guide their strategies, understanding the implications of income inequality becomes essential for fostering equitable outcomes. By leveraging the Gini coefficient in predictive analytics, stakeholders can gain insights into the factors influencing disparities and develop targeted interventions that promote better outcomes for disadvantaged populations.
Policy Implications and Recommendations
Understanding the implications of the Gini coefficient can guide policymakers in addressing income inequality effectively. To mitigate disparities, targeted fiscal policies, robust social safety nets, and progressive taxation are essential components of a comprehensive strategy. Such measures can redistribute wealth more equitably and provide support for marginalized communities, ultimately promoting greater social cohesion. Additionally, education and workforce development initiatives play a crucial role in empowering disadvantaged populations. By investing in education and skills training, policymakers can equip individuals with the tools they need to improve their economic prospects. This approach not only helps reduce income inequality but also fosters a more skilled and competitive workforce, driving economic growth. Continued monitoring and analysis of the Gini coefficient at both national and local levels are vital for informed policy decisions. By regularly assessing income distribution trends, policymakers can identify emerging challenges and adapt their strategies accordingly. Furthermore, engaging with community stakeholders and affected populations in the policymaking process can ensure that interventions are responsive to the unique needs of different communities, ultimately fostering a more equitable society.
Conclusion: The Importance of Measuring Inequality
The Gini coefficient remains a vital tool for measuring and understanding income and wealth inequality. While it provides critical insights into the distribution of resources, it is essential to utilize it alongside other metrics to capture the full picture of economic disparity. Recognizing the strengths and limitations of the Gini coefficient enables stakeholders to work towards more equitable societies, ensuring that economic growth benefits all members of the population. In an era characterized by increasing awareness of social and economic inequalities, the Gini coefficient serves as a fundamental reference point for policymakers, researchers, and advocates alike. By fostering a deeper understanding of income distribution and its implications, stakeholders can develop effective strategies to combat inequality and promote social justice. Through continued dialogue and collaboration, we can strive toward a future where equitable economic opportunities are accessible to all, contributing to a more just and prosperous society.
Sponsored Links